How to approach Academic Writing Task 1
In the IELTS Academic Writing test, you will have one hour to complete both of the two set writing tasks. Keep an eye on the time it takes you to complete practice Tasks 1 and 2 to make sure you don’t go too far over, and to use as a benchmark for how long you can expect each task to take you.
In the actual test, you will move from the first to the second task without a break. However, while practising, you may wish to reflect on the outcomes of practice Task 1 using the model answer provided before moving on to practice Task 2. Or you may wish to complete them both before looking at the model answers to give you a more accurate sense of timing.
An easy reminder…
Q: How long should I spend on IELTS Writing Task 1?
A: We suggest 20 minutes – saving 40 minutes for Task 2.
Q: How many words for IELTS Writing Task 1?
A: 150 words is about the right length, but don’t be afraid to go a little over.
Q: Should I be formal or conversational in style?
A: You should write in a formal style, suited to an academic environment.
Q: What are the do’s and don’ts in IELTS Writing task 1?
A: Do pay attention to time - task 1 is worth one third of the total marks (while task 2 is worth two thirds), Don’t let nervousness stop you from trying your best.
Get more tips to help you prepare for the writing tasks
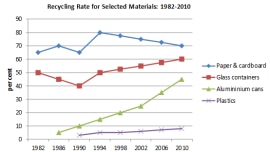
Task 1 – Take a look at the chart below and perform the task as outlined:
This graph shows the proportion of four different materials that were recycled from 1982 to 2010 in a particular country.
Summarise the information by selecting and reporting the main features, making comparisons where relevant.